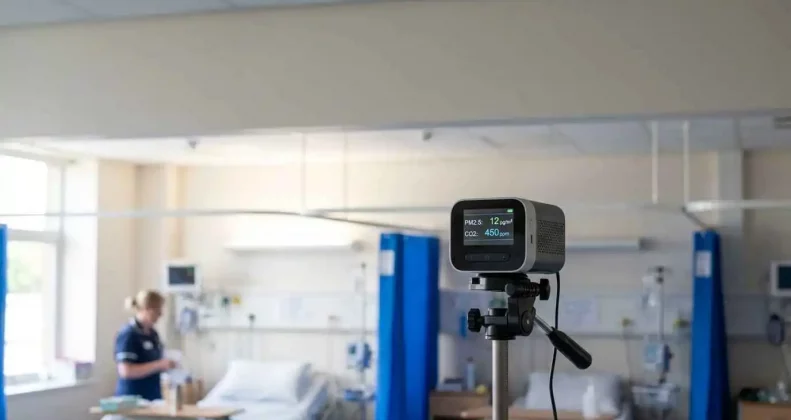
Hospitals are one of the few buildings where the air itself is part of the treatment. Patients recovering from surgery, people with weakened immune systems, and staff working long shifts all depend on air that is clean, well ventilated and properly monitored. Yet most guidance you’ll find online is written for American or Canadian hospitals, quoting standards that don’t apply here. This guide is written for UK estates and facilities teams, and covers what actually matters: HTM 03-01, CQC expectations, HSE exposure limits, what gets measured in each part of the building, and what it costs. What is Indoor Air quality Testing for Hospitals? Indoor air quality testing for hospitals is the measurement of airborne pollutants, ventilation performance and comfort conditions inside a healthcare building. It checks whether the air in wards, theatres, treatment rooms and public areas meets the standards expected for patient safety and staff wellbeing. Unlike testing in an office, hospital testing has to account for medical gases, sterilising chemicals, surgical smoke and specialist ventilation systems as well as the ordinary pollutants found in any building. Why hospitals need testing more than other buildings Three things make healthcare different. Patients are more vulnerable. People in intensive care, neonatal units and oncology wards often have suppressed immune systems. Airborne particles and bioaerosols that would be harmless elsewhere can pose a real risk here. The building generates its own pollutants. Anaesthetic gases leak from machines and masks. Cold sterilisation uses formaldehyde and glutaraldehyde. Electrosurgery produces surgical smoke, which carries fine particles and can contain bacteria and viruses. Cleaning regimes use disinfectants at a scale no office would. Ventilation is safety critical. Operating theatres, isolation rooms and pharmacy clean rooms rely on specified air change rates and pressure differentials. If those drift out of specification, infection control is compromised and it usually happens silently. Which UK standards apply? This is where most online advice goes wrong for British hospitals. The key documents here are: HTM 03-01 (Health Technical Memorandum) — the core NHS guidance on specialised ventilation in healthcare premises. It sets expectations for air change rates, filtration, pressure regimes and, importantly, annual verification of critical ventilation systems. HSE Workplace Exposure Limits (EH40) — the legal limits for staff exposure to substances such as nitrous oxide, formaldehyde and glutaraldehyde. COSHH Regulations — where hazardous substances are used, exposure must be assessed and controlled, with monitoring where necessary. CQC fundamental standards — premises must be safe and suitable. Ventilation and air quality evidence supports Regulation 12 (safe care and treatment) and Regulation 15 (premises and equipment). BREEAM Hea 02 — relevant for new-build or major refurbishment healthcare projects, where post-construction indoor air quality testing is often a credit requirement. What gets tested in each part of a hospital? Different clinical areas need different things checked. Here’s a practical breakdown. Hospital area Key risks What’s typically measured Suggested frequency Operating theatres Anaesthetic gases, surgical smoke, ventilation failure Nitrous oxide, volatile anaesthetics, particulates, air change rate, pressure differential Annual verification, plus after any works ICU / NICU Vulnerable patients, bioaerosols PM2.5, CO₂, temperature, humidity, filtration performance Annual, or continuous monitoring Isolation rooms Airborne infection control Pressure differential, air change rate, containment integrity Annual verification minimum Sterile services / decontamination Formaldehyde, glutaraldehyde, ethylene oxide Chemical vapour levels against HSE limits, local exhaust performance Annual, plus COSHH-triggered General wards Overcrowding, poor ventilation, comfort complaints CO₂, PM2.5, VOCs, temperature, humidity Annual or on complaint Waiting areas & receptions High occupancy, outdoor pollution ingress CO₂, PM2.5, NO₂ ingress from nearby roads Annual or on complaint Pharmacy clean rooms Particulate contamination Particle counts, air change rate, pressure cascade Per clean room classification schedule Which pollutants are measured? A hospital survey usually covers three groups. Ordinary building pollutants — carbon dioxide (a proxy for ventilation adequacy), fine particulate matter (PM2.5 and PM10), volatile organic compounds (VOCs), temperature and relative humidity. Healthcare-specific chemicals — nitrous oxide and volatile anaesthetic agents in theatres and recovery, formaldehyde and glutaraldehyde in decontamination areas, and ethylene oxide where used for sterilisation. Ventilation performance — air change rates, pressure differentials between rooms, filter condition and airflow direction. In critical areas this matters as much as the pollutant readings themselves. Where a hospital sits beside a busy road, outdoor nitrogen dioxide drawn in through intakes can also be an issue. In those cases we’d usually pair the indoor survey with external air quality monitoring to see how much of the problem is coming from outside. How the testing process works Step 1 — Scoping. We agree which areas to survey, which pollutants matter in each, and how to work around clinical activity. Nothing is scheduled without the estates and infection control teams signing it off. Step 2 — On-site survey. Instruments are placed at breathing height in occupied areas. Some readings are spot measurements; others log continuously over several days to capture how conditions change through a working week. Step 3 — Ventilation checks. Where relevant, air change rates and pressure differentials are measured against HTM 03-01 expectations. Step 4 — Analysis and reporting. Results are compared against HSE exposure limits, HTM guidance and recognised comfort criteria. The report sets out what passed, what didn’t, and what to do about it written so it can go straight to a board or a CQC inspector. How much does hospital air quality testing cost? A focused survey of a small number of areas typically starts from around £1,200 to £2,500. A full multi department survey across a large hospital site generally falls between £4,000 and £10,000, depending on the number of locations, the pollutants involved and whether ventilation verification is included. Most surveys take one to three days on site, with the report following within two to three weeks. A real project example We were asked to investigate a hospital department where staff had reported persistent headaches and stuffiness, but a previous check had found “nothing wrong.” The earlier assessment had taken single spot readings during a quiet afternoon. We logged continuously across a full week instead.


Gyms put more strain on indoor air than almost any other type of building. Dozens of people breathing hard in one room, chalk dust in the lifting area, disinfectant sprayed on equipment all day, and often a studio with no windows at all. Members come to get healthier but if the ventilation can’t keep up, they’re breathing stale, particle heavy air while their lungs are working at full capacity. This guide explains how professional testing works in the UK, what it costs, what the law actually requires, and what to do with the results. Why Gym Air Gets Worse than Office Air When you exercise, your breathing rate can climb several times above resting level. You’re pulling far more air into your lungs and far more of whatever is in it. Research on particle deposition shows the amount reaching your lungs roughly doubles between rest and intense exercise, so a pollution level that’s unremarkable at a desk delivers a much bigger dose during a spin class. At the same time, the gym itself is generating pollutants: The combination is what makes gyms unusual. It’s not one problem, it’s five happening at once in the same building. What UK law actually requires This is where most articles get vague, so here’s the plain version. The Workplace (Health, Safety and Welfare) Regulations 1992 require every workplace gyms included to have effective and suitable ventilation with a sufficient quantity of fresh air. That’s a legal duty to your staff, and by extension it shapes the environment your members train in. COSHH applies where cleaning chemicals and disinfectants are used, which in a gym is constantly. Building Regulations Part F sets ventilation requirements for new builds and major refurbishments. And if you have a café or kitchen on site, BESA TR19 Grease governs extract ductwork cleaning grease build up is a leading cause of commercial fires. None of these say “you must test your air annually.” But if a member or employee raises a complaint, or if the HSE or your local environmental health team asks how you know your ventilation is adequate, test data is the only real answer. Without it, you’re relying on the fact that nobody has complained yet. What indoor air quality testing for gyms actually involves Here’s the part the sensor companies skip. A professional test isn’t someone waving a handheld gadget around for ten minutes it’s a structured survey designed to capture how your building behaves under real conditions. Indoor air quality testing for gyms typically runs like this: Stage What happens Typical timing 1. Survey design We agree which areas to test — gym floor, studios, changing rooms, reception — and when, based on your busiest sessions Before the visit 2. On-site monitoring Calibrated equipment records CO₂, PM2.5, PM10, VOCs, temperature and humidity across peak and off-peak periods 24 hours to 7 days 3. Ventilation check Airflow rates measured and compared against what the building was designed to deliver Same visit 4. Analysis Results assessed against CIBSE, Part F and WHO guideline values 1–2 weeks 5. Report Findings by area, where limits were exceeded and when, plus prioritised recommendations With analysis The timing point matters more than anything else here. A test carried out at 11am on a Tuesday will show you a healthy building. The same room at 6:30pm during a full class can look completely different. Any survey that doesn’t cover your peak occupancy isn’t telling you much. What the numbers mean You don’t need to be an engineer to read a report, but it helps to know what the key figures are pointing at. Measurement Good Needs attention What it tells you CO₂ Under 1,000 ppm Over 1,500 ppm How much fresh air is reaching the room PM2.5 Under 15 µg/m³ Over 35 µg/m³ Fine particles from chalk, dust and outdoor air Relative humidity 40–60% Under 30% or over 70% Comfort, mould risk and airway irritation VOCs Low, stable readings Sustained spikes after cleaning Chemical load from products and off-gassing A useful way to read a report: CO₂ tells you whether your ventilation is sized correctly for how busy you actually are. Particulates tell you whether cleaning and floor management are working. VOCs usually point straight at your cleaning routine. Signs your gym needs testing now You don’t always need data to know something’s off. Common warning signs include a stale or sweaty smell that never quite clears between classes, condensation on mirrors and windows at normal temperatures, members mentioning headaches or unusual tiredness after sessions, visible dust in sunlight near the free weights, and staff complaints in the same rooms week after week. If two or more of those sound familiar, a survey will usually find something worth fixing. The same applies if you’ve recently refurbished, changed your opening hours, or significantly increased class sizes all three change the ventilation demand on a building that was designed for something else. A real project example We were asked to carry out indoor air quality testing for gyms at an independent fitness studio in the West Midlands, where members had been complaining of headaches during evening classes and staff had raised concerns about the spin studio in particular. Monitoring across a full week showed the main gym floor performed reasonably well, but CO₂ in the windowless spin studio climbed past 2,400 ppm within twenty minutes of a class starting and stayed there. Airflow measurements confirmed the studio’s supply had been reduced during an earlier refurbishment and never rebalanced. PM2.5 was also elevated in the free weights area, tracking closely with chalk use. The fixes were straightforward once the cause was clear: rebalancing the ventilation to restore supply to the studio, capping class sizes at a level the airflow could actually support, moving to a low VOC cleaning product, and switching to liquid chalk. Follow up monitoring showed peak CO₂ down to around 1,100 ppm. The complaints stopped. The point is that the problem wasn’t obvious from inside the building it needed measuring to find.
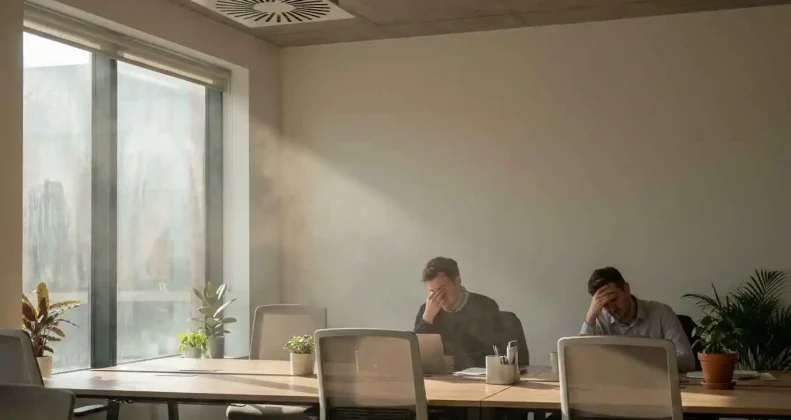
We spend around 90% of our time indoors, and the air inside a home is often more polluted than the air outside it. The tricky part is that poor indoor air quality rarely announces itself. It shows up as tired staff, a stuffy meeting room, or a headache that clears the moment you step outside. This guide covers the warning signs UK building owners, landlords and facilities managers should look for, what each one usually means, and when it’s worth getting the air properly tested. The Quick answer: what are the signs of poor indoor air quality? The most common signs are stuffy or stale air, musty smells, condensation on windows, visible mould, unusual dust build up, and occupants reporting headaches, tiredness, itchy eyes or worsening asthma that improve once they leave the building. The clearest single indicator is symptoms that follow the building if people feel better at the weekend and worse on Monday, the building is very likely the cause. First: some signs need immediate action Before the everyday warning signs, a few situations are urgent rather than routine. Act straight away if you notice: Everything below is about the slower, less obvious problems. 1. The air feels stuffy or stale Stuffy air almost always means not enough fresh air is getting in. As people breathe, carbon dioxide builds up, and with it a general heaviness that makes rooms feel tired. CO2 is the easiest indicator to measure and the best proxy for ventilation. Outdoor air sits at roughly 420 ppm. Indoors, below 800 ppm suggests good ventilation, 800–1,500 ppm is acceptable but worth watching, and consistently above 1,500 ppm means ventilation is inadequate. In UK schools, BB101 sets a daily average limit of 1,500 ppm for mechanically ventilated spaces for exactly this reason. 2. Symptoms improve when people leave the building This is the single most useful diagnostic. If headaches, tiredness, or itchy eyes ease within an hour or two of leaving and return the next morning, the building is the common factor. When several people across the same floor or zone report it, you’re looking at a building-level problem rather than individual sensitivity. Ask people to note which rooms and what time of day the pattern usually points straight at the cause. 3. There’s a musty or earthy smell A musty smell means moisture and microbial growth somewhere, even when you can’t see it. The source is often hidden: behind plasterboard, under flooring, inside wall cavities, or in ductwork. Air fresheners make it worse, not better they mask the smell while the moisture keeps working on the building fabric. If the smell returns after cleaning, the source is still active. 4. Condensation on windows and cold surfaces Regular condensation means indoor humidity is too high for the surface temperatures in the building. It’s most visible on windows in the morning, but it also happens on cold external walls, around window reveals, and on pipework. Relative humidity should sit between 40% and 60%. Above 60% and you’re into the range where mould, dust mites and bacteria thrive. Below 40% and you get dry eyes, irritated throats and static. 5. Visible mould or dark patches Mould is not a cosmetic issue it’s evidence that moisture has been present long enough for growth to establish. Check corners of external walls, behind furniture pushed against cold walls, around windows, under sinks, and in poorly ventilated bathrooms. For rented homes in England, this matters legally. Under the Homes (Fitness for Human Habitation) Act 2018, a property with serious damp and mould can be considered unfit for habitation, and Awaab’s Law now sets strict timescales for social landlords to investigate and fix damp and mould hazards. 6. Dust builds up faster than it should If surfaces need dusting again within days, or dust collects heavily around supply grilles and return vents, filtration or air distribution isn’t working properly. Fine particles are recirculating instead of being captured. Visible dust is the part you can see. PM2.5 particles small enough to reach deep into the lungs is invisible and matters more for health. The WHO recommends an annual average below 5 µg/m³. 7. Occupants report headaches and tiredness Persistent afternoon headaches and heavy tiredness across a team usually trace back to raised CO2 and poor ventilation. Research consistently links elevated indoor CO2 with reduced concentration and slower decision making. If your meeting rooms are the worst offenders, that’s a classic sign small sealed rooms with several people fill with CO2 quickly. 8. Asthma and allergy symptoms get worse indoors More inhaler use, more sneezing, more itchy eyes inside the building points to allergens or irritants in the air: dust mites thriving in high humidity, mould spores, pet dander, or fine particles from cooking and traffic outside. This one deserves attention rather than tolerance. Children and older adults feel it first. 9. A chemical or “new” smell that lingers That smell after new carpet, fresh paint, or new furniture is VOCs volatile organic compounds off gassing from the materials. Sources include paints, adhesives, cleaning products, printers, and MDF furniture. Most off gassing drops sharply in the first few weeks, but poor ventilation lets it linger far longer. In new or refurbished buildings, this is one of the most common causes of complaints in the first months of occupation. 10. Rooms are uneven hot, cold, draughty or airless If one end of a floor is stifling and the other is cold, the ventilation system isn’t distributing air properly. Blocked grilles, closed dampers, poorly balanced systems and unsealed ductwork all cause it. Where air doesn’t reach, pollutants accumulate. 11. The ventilation system is neglected Ask when filters were last changed, when the system was last serviced and balanced, and whether extract fans in kitchens and bathrooms actually work. A common and easily missed problem: extract fans that run but no longer move any meaningful air, or trickle vents in windows that occupants have taped shut against draughts. Sign, Likely Cause and What to do next Sign

You’ll see PM2.5 and PM10 on air quality reports, planning conditions and monitoring data all the time. They sound similar, but they behave differently, come from different places, and are treated differently under UK law. This guide explains the difference in easy way what each one is, where it comes from, what it does to your health, and what the UK rules actually say. If you’re a developer, contractor or building manager, the last few sections explain why this matters for your project. What’s the difference between PM2.5 and PM10? PM10 is any airborne particle smaller than 10 micrometres across. PM2.5 is any particle smaller than 2.5 micrometres. Both are types of particulate matter the technical name for tiny bits of solid and liquid floating in the air. To picture the scale: a human hair is roughly 50 to 70 micrometres wide. PM10 is about a seventh of that. PM2.5 is around a twentieth. One thing that trips people up: PM2.5 is technically inside PM10. Any particle under 2.5 micrometres is also under 10. So when people talk about “PM10” in practice, they usually mean the coarser particles between 2.5 and 10 micrometres. PM2.5 vs PM10 at a glance PM10 PM2.5 Size Under 10 micrometres Under 2.5 micrometres Common name Coarse particles Fine particles Mainly comes from Physical processes — construction dust, crushing, road dust, brake and tyre wear, pollen, sea spray Combustion — vehicle exhaust, wood burners, industrial plant, plus particles formed in the atmosphere from NOx and SO2 How far it travels Settles quickly, usually near the source Stays airborne for days and can travel hundreds of miles Where it reaches in the body Mostly caught in the nose and throat; some reaches the upper airways Deep into the lungs and across into the bloodstream UK annual objective 40 µg/m³ 20 µg/m³ (with a 10 µg/m³ target for England by 2040) WHO guideline (2021) 15 µg/m³ annual 5 µg/m³ annual Typical UK concern Construction and demolition dust, nuisance complaints Long-term health impact, planning policy, statutory targets Where does each one come from? PM10 usually comes from something physical happening material being broken, moved or disturbed. Construction and demolition are big contributors, along with crushing and grinding, quarrying, agricultural work, and dust lifted off roads. Brake and tyre wear from traffic also produce PM10, which is why it doesn’t disappear just because vehicles go electric. Natural sources include pollen, sea spray and wind-blown soil. PM2.5 usually comes from something burning. Vehicle exhaust, domestic wood burners and open fires, gas boilers, industrial combustion and power generation are the main ones. A significant share is also “secondary” it forms in the atmosphere when gases like nitrogen oxides (NOx) and sulphur dioxide (SO2) react and condense into solid particles. That’s part of why PM2.5 drifts so far from where it started. Why PM2.5 is considered more harmful Size decides where a particle ends up in your body. PM10 is largely trapped by the nose, throat and upper airways. It can still cause real problems coughing, wheezing, and flare ups for people with asthma or bronchitis but much of it doesn’t get far. PM2.5 is small enough to pass through those defences, travel deep into the lung tissue, and cross into the bloodstream. That’s why it’s linked to a much broader set of conditions: reduced lung function, worsening asthma and COPD, heart disease, strokes, and effects on pregnancy outcomes. The UK Government’s own advisory committee treats long term PM2.5 exposure as the air pollutant of most harm to health. Ultrafine particles PM1 and PM0.1 are smaller still and likely more penetrating again, but the health evidence and the regulations remain built around PM10 and PM2.5. What the UK rules actually say This is where most explainers stop short, so here’s the current position. The national objectives. Under UK air quality legislation, the annual mean objective is 40 µg/m³ for PM10 and 20 µg/m³ for PM2.5. PM10 also has a 24 hour objective of 50 µg/m³, which shouldn’t be exceeded more than 35 times a year. Scotland has adopted tighter values than the rest of the UK. The Environment Act 2021 targets. England now has two legally binding PM2.5 targets: an annual mean concentration of no more than 10 µg/m³ by the end of 2040, and a 35% reduction in population exposure by 2040 against a 2018 baseline. DEFRA has also set interim targets for 2030. Wales has introduced its own PM2.5 target setting duty. The WHO guidelines. The World Health Organization tightened its guidelines in 2021 to 5 µg/m³ annual mean for PM2.5 and 15 µg/m³ for PM10. These aren’t legally binding in the UK, but they’re increasingly referenced as the health based benchmark and you’ll see them cited in planning documents, particularly in London. Why this matters if you’re developing or building Here’s the practical bit that general air quality articles miss. PM2.5 is now a planning consideration in England. Following DEFRA’s interim planning guidance published in October 2024, applicants are expected to show they’ve identified the key sources of PM2.5 in their scheme and taken reasonable steps to reduce emissions. This applies to any development that would normally need an air quality assessment. Practically, that pushes schemes towards low-emission heating, fewer combustion sources, and reduced vehicle trips. PM10 is the one your construction phase gets judged on. Construction dust is assessed as PM10 under IAQM guidance, across four separate phases demolition, earthworks, construction and trackout. If your planning permission includes a dust condition, the dust management plan you submit will be built around controlling PM10 at the site boundary. Our guide to dust management plans for construction walks through what councils expect to see. Both get measured differently. PM10 and PM2.5 are usually captured through air quality monitoring using automatic analysers, alongside dispersion modelling to predict future concentrations. On dusty sites, real-time PM10 monitors with agreed trigger levels are common. A real project example We worked on a residential scheme in the West Midlands where the site sat close

Schools and care homes have something important in common: they hold some of the people most affected by poor air quality, for some of the longest hours of the day. Children’s lungs are still developing. Older residents in care homes often already live with respiratory or heart conditions. Both settings also answer to a regulator that expects evidence, not assumptions, about the environment they provide. This guide explains why air quality monitoring matters in both settings, what UK guidance actually requires, what to monitor, and what a professional survey involves with genuine UK standards throughout, not the US benchmarks most guides online are built around. Why air quality monitoring matters for schools and care homes Air quality monitoring gives schools and care homes real evidence of the conditions people are breathing, rather than a guess. Both settings hold occupants who are more vulnerable than the general population, spend long uninterrupted hours indoors, and are subject to scrutiny from parents, families, regulators and inspectors. Monitoring turns “we think the building is fine” into a documented, defensible fact. Schools: what UK guidance requires UK school ventilation and indoor air quality are governed by Building Bulletin 101 (BB101), the Department for Education’s guidance on ventilation, thermal comfort and indoor air quality in schools. It sets a working limit of 1,500 ppm CO2 as a daily average during the school day, and recommends that levels shouldn’t exceed 2,000 ppm for more than a short period during any occupied session. CO2 is used as a proxy for ventilation adequacy high CO2 means the room isn’t getting enough fresh air, and that carries other pollutants and higher infection risk with it. Beyond CO2, schools increasingly monitor: Ofsted inspections don’t measure air quality directly, but a well ventilated, comfortable classroom environment sits within the wider standard of a safe, well managed school and monitoring data gives a school business manager or headteacher hard evidence to show governors, parents or an inspector if it’s ever questioned. Care homes: what UK guidance requires Care homes are regulated by the Care Quality Commission (CQC), and while CQC doesn’t set a numerical air quality limit, its Fundamental Standards require that premises are suitable, safe, and properly ventilated for the people living there. HSE guidance on workplace ventilation applies too, since care homes are also a workplace for staff. The pollutants that matter most in a care setting are different from a school: Family members increasingly ask about the environment their relative lives in, and a care home that can produce genuine monitoring data has a stronger answer than one relying on “the building feels fine.” Schools vs care homes: monitoring priorities compared Factor Schools Care Homes UK guidance Building Bulletin 101 (DfE) CQC Fundamental Standards, HSE workplace guidance Primary indicator CO2 (target: 1,500 ppm daily average) CO2 and PM2.5 given resident vulnerability Occupancy pattern Sharp spikes at class changeover and breaks Steady, near-continuous occupancy Most vulnerable to Developing lungs, higher breathing rate per body weight Existing respiratory and cardiovascular conditions Common trigger for testing Parent concern, stuffy classroom reports, refurbishment CQC inspection prep, family concern, new build/refurb How our monitoring surveys work Step 1 — Survey design. We agree which rooms matter most busiest classrooms, communal lounges, dining areas and which pollutants to monitor based on the building and its occupants. Step 2 — On-site monitoring. We install monitoring equipment for the agreed period, capturing CO2, PM2.5, temperature and humidity as needed, without disrupting the school day or residents’ routines. Step 3 — Analysis and reporting. We compare the results against BB101 or CQC relevant benchmarks and produce a clear report your governors, senior management team or CQC inspector can actually use plain findings, not just raw data. A real project example We recently carried out an indoor air quality survey for a primary school in the West Midlands after staff raised concerns about stuffy afternoon classrooms. Monitoring showed CO2 regularly exceeding 2,000 ppm in two ground-floor classrooms during the final teaching period well above the BB101 threshold. The cause turned out to be a simple one: mechanical ventilation in those two rooms was running on a schedule that didn’t match the actual timetable. Adjusting the ventilation schedule brought both rooms back under the daily average target within a week, verified by a short follow up monitoring period. The whole process, from initial survey to resolved problem, took under a month far simpler and cheaper than the plant replacement the school had been quoted for elsewhere. What does a monitoring survey cost? For a single school or care home, a monitoring survey covering several key rooms typically costs in the region of £800 to £2,500, depending on how many rooms are monitored and for how long. Multi site providers and academy trusts benefit from a lower per-site cost when several buildings are surveyed together. Most surveys run for one to four weeks to capture a representative picture of daily and weekly patterns. Common mistakes to avoid How FreshBreeze can help We carry out indoor air quality monitoring for schools, academy trusts and care homes across London, Birmingham and Manchester, benchmarked against BB101 and relevant CQC and HSE standards. If you’re not sure what your building needs, we’ll tell you honestly before any equipment goes on site. Find out more about our indoor air quality testing or air quality monitoring services. Conclusion Schools and care homes both hold people who are more affected by poor air than most of us and both now face real expectations, from regulators, parents, and families, to show the environment is properly managed. Monitoring is what turns that expectation into evidence. A short, well designed survey tells you exactly where the problems are, whether that’s a ventilation schedule out of sync with the school day or a lounge that needs better air exchange and gives you the data to prove it’s been fixed. FAQs
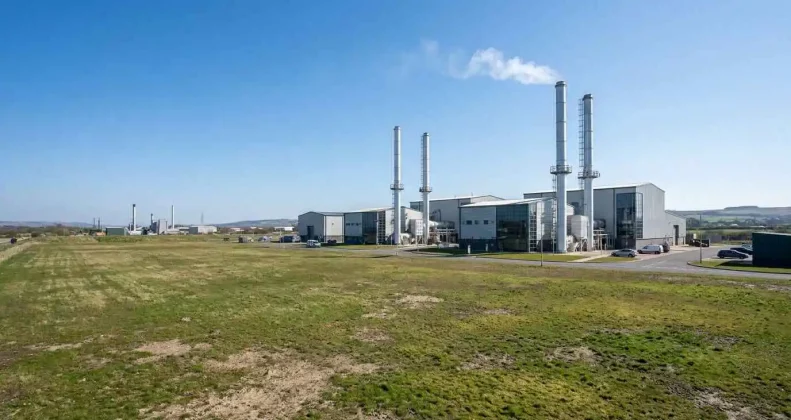
Industrial developments face tougher air quality scrutiny than almost any other type of scheme. Between a busy planning process and, very often, a separate environmental permit, an industrial project can need two different air quality assessments looking at two different things. Get either wrong and you’re facing objections, delays, or refusal. This guide explains what an air quality assessment for an industrial development involves, when you need one, how the planning and permitting sides fit together, what it costs, and the mistakes that hold projects up. What is an air quality assessment for industrial developments? An air quality assessment for an industrial development is a technical study of how the site’s emissions will affect local air quality, and whether those effects are acceptable under UK planning and permitting rules. It looks at pollutants from the site’s processes, plant and traffic, predicts where they’ll go, and compares the results against national air quality objectives. Industrial sites are different from housing or commercial schemes in one important way: they often release pollutants from fixed points such as chimneys, flues and process stacks, on top of the emissions from vehicles coming and going. That means the assessment usually has to deal with both point-source emissions and traffic emissions together. When does an industrial development need an air quality assessment? You’ll usually need one if any of these apply: In practice, most sizeable industrial schemes trigger at least one of these, which is why air quality is best considered right at the start rather than bolted on before submission. The two sides: planning and permitting This is the part the other guides miss, and it’s the thing that catches industrial developers out. An industrial project can need two separate air quality assessments for two separate consenting processes. Feature Planning air quality assessment Environmental permit air quality assessment Who assesses it Local planning authority Environment Agency (or SEPA / NRW) Main focus Traffic emissions, construction dust, effect on nearby receptors Process and stack emissions from the operation itself Typical method IAQM guidance, dispersion modelling of road traffic EA H1 risk assessment, stack dispersion modelling When it’s needed To support the planning application To obtain a permit to operate The two often overlap and should be planned together. Running them in isolation is a common and expensive mistake the emissions data, modelling and receptor information can usually be shared across both. What does the assessment cover? An industrial air quality assessment typically looks at several emission sources at once. Point source (stack) emissions. Where a process releases pollutants through a chimney or flue, the assessment models how those emissions disperse and where they land. This is central to any environmental permit application and often feeds into a stack height assessment to make sure the discharge point is tall enough. Combustion plant. Boilers, generators and CHP units release nitrogen oxides (NOx) and other pollutants. These are modelled against the relevant objectives. Traffic emissions. HGVs and staff vehicles add roadside pollution, particularly NO2 and particulate matter. This is usually assessed with dispersion modelling of the local road network. Construction and dust. During the build, demolition and earthworks can generate dust, usually managed through a construction dust assessment and a dust management plan. How the assessment process works Step 1 — Scoping. We confirm what’s needed for both planning and permitting, identify the emission sources and the sensitive receptors, and agree the approach with the authorities where useful. Step 2 — Baseline. We establish existing air quality around the site using background concentration data and, where required, air quality monitoring. Step 3 — Modelling. We use dispersion modelling typically ADMS to predict how emissions from stacks, plant and traffic will affect concentrations at nearby receptors. Step 4 — Assessment and mitigation. We compare the predicted levels against the national air quality objectives and, if needed, recommend mitigation such as taller stacks, cleaner plant, or emission controls. Step 5 — Reporting. You receive a clear report suitable for the planning application, the permit application, or both. What does an industrial air quality assessment cost? Because industrial assessments usually involve stack modelling and multiple emission sources, they sit at the more detailed end of the scale. A full assessment for an industrial development generally ranges from around £3,000 to £12,000 or more, depending on the number of sources, whether both planning and permitting are involved, and the complexity of the modelling. Preparation typically takes four to eight weeks, sometimes longer where baseline monitoring is required first. A real project example We supported an industrial operator whose site needed both planning permission and an environmental permit for new combustion plant. The two processes were originally being handled separately by different parts of the project team, which risked duplicated work and inconsistent emissions figures. We brought the air quality work together: a single emissions inventory feeding both the planning assessment and the permit’s stack dispersion modelling. That kept the figures consistent across both applications, avoided repeating the modelling twice, and gave both the council and the Environment Agency the evidence they needed. The result was a smoother approval on both fronts and a lower overall cost than running the two in isolation. The lesson: on industrial schemes, joining up planning and permitting early saves both time and money. Common mistakes to avoid How FreshBreeze can help We prepare air quality assessments for industrial developments across London, Birmingham and Manchester, covering both planning applications and environmental permits. From stack dispersion modelling to construction dust, we join the pieces up so you’re not paying for the same work twice. Learn more about our air quality assessment services or our support with environmental permit applications. Conclusion Air quality is one of the biggest technical hurdles an industrial development has to clear, precisely because it usually sits across two consenting processes at once planning and permitting. The projects that move smoothly are the ones that treat air quality as a single joined up piece of work from the start: one emissions inventory, consistent modelling, and early
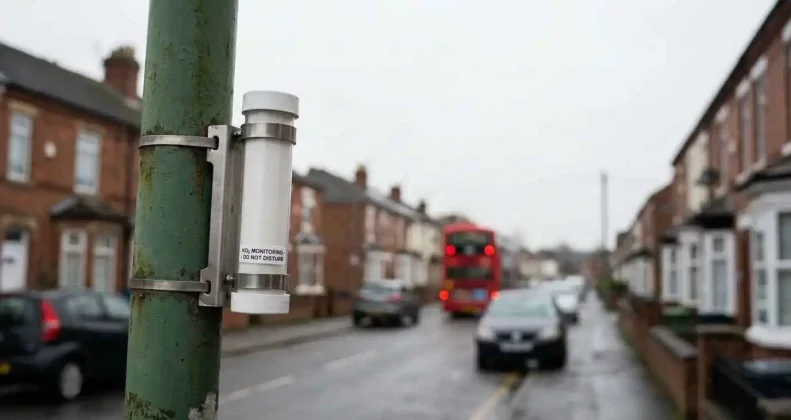
Air quality monitoring sounds simple: put a monitor out, collect the numbers, write the report. In practice, small errors in how a survey is set up and analysed can produce data that’s misleading, rejected by a planning officer, or useless for the decision it was meant to support. We prepare monitoring surveys for planning and compliance across the UK, and we see the same mistakes come up again and again. Here are the nine that cause the most trouble, and exactly how to avoid each one. Why getting air quality monitoring right matters Most professional monitoring in the UK is done for a reason: to establish a baseline for a planning application, to verify a dispersion model, or to discharge a planning condition. If the data is wrong, the consequences aren’t just academic. A flawed survey can mean a rejected report, weeks of lost time waiting to re monitor, or a decision made on numbers that don’t reflect reality. Good monitoring follows recognised methods chiefly IAQM and DEFRA guidance so the results stand up to scrutiny. The 9 most common air quality monitoring mistakes # The mistake The fix in one line 1 Poor monitor placement Site monitors where they represent real exposure, following DEFRA siting rules 2 Monitoring for too short a period Run surveys long enough to be representative, then annualise the data 3 Skipping bias adjustment Always apply a bias adjustment factor to diffusion tube results 4 Using the wrong equipment Match the method to the purpose; use reference or MCERTS-grade kit where needed 5 Neglecting calibration and maintenance Keep equipment calibrated and clean throughout the survey 6 Ignoring weather and meteorology Record wind and weather so results can be interpreted properly 7 Missing the right sensitive receptors Monitor at the locations where people are actually exposed 8 Misreading the data Compare against the correct UK objectives and account for sensor limits 9 No clear monitoring objective Decide what the survey must prove before any kit goes out 1. Poor monitor placement This is the most common mistake, and the one that does the most damage. A monitor only measures the air it’s actually exposed to. Put it in the wrong spot and the readings can look precise while being completely unrepresentative. The usual errors are placing a monitor too close to a single pollution source (a car park exit, a boiler flue, a busy junction), tucking it into a sheltered corner where air can’t circulate, or mounting it at the wrong height. For a professional survey supporting an air quality assessment, monitors should be sited to reflect genuine exposure and follow DEFRA siting criteria the right distance from the kerb, the right height, and clear of obstructions. The fix: Decide what you’re measuring first, then site the monitor to represent that. Follow DEFRA guidance on placement rather than picking the most convenient spot. 2. Monitoring for too short a period A few days of data tells you very little. Air pollution varies hugely with traffic patterns, season and weather, so a short snapshot can be well above or well below the true annual average. For a baseline NO2 survey using diffusion tubes, you generally need several months of data often a full twelve months, or at least a period that can be reliably scaled up. This is where annualisation comes in: a correction that adjusts a shorter survey to represent a typical year using nearby long running monitoring stations. Skip it, and your figures won’t be accepted. The fix: Run the survey long enough to be representative, and annualise short-term data against a local continuous monitor. 3. Skipping bias adjustment on diffusion tubes This one is specific to NO2 diffusion tube surveys and it’s a frequent reason data gets challenged. Diffusion tubes are reliable and cost effective, but they can slightly over read or under read compared to reference grade analysers. Bias adjustment corrects for this using a national or local factor. Without it, your NO2 concentrations are effectively unverified, and a planning officer or their environmental health colleague is right to question them. The fix: Always apply the appropriate bias adjustment factor, and state clearly in your report which factor you used and why. 4. Using the wrong equipment for the job Not every monitor suits every task. Low cost sensors are useful for indicative work and spotting trends, but they don’t carry the accuracy needed for regulatory decisions. Using a cheap sensor where a reference or MCERTS grade instrument is required produces data that simply won’t be accepted. Equally, using an expensive continuous analyser for a job that diffusion tubes would cover perfectly well wastes money. The fix: Match the method to the purpose. For planning and compliance, use equipment of the right standard MCERTS certified or reference equivalent where the decision demands it. 5. Neglecting calibration and maintenance Monitoring equipment drifts over time. Dust builds up on optical particulate sensors, and readings gradually lose accuracy like taking photos through a smudged lens. A monitor left untouched for months may still produce numbers, but they won’t be trustworthy. The fix: Calibrate instruments to the manufacturer’s schedule, keep sensor inlets clean, and keep a maintenance log you can show alongside the data. 6. Ignoring weather and meteorology Pollution behaviour is driven by weather. Wind speed and direction, temperature and humidity all shape where pollutants go and how monitors respond. Humidity in particular can cause some particulate sensors to over read. Without weather data alongside your pollutant readings, you can’t explain the numbers or attribute them to a source properly. The fix: Record local meteorological data during the survey, or reference a nearby weather station, and factor it into the analysis. 7. Missing the right sensitive receptors In UK air quality work, what matters is exposure at sensitive receptors homes, schools, hospitals and care homes where people spend time. A common mistake is monitoring where it’s convenient rather than where people are actually exposed, which means the survey answers the wrong question. The fix: Identify
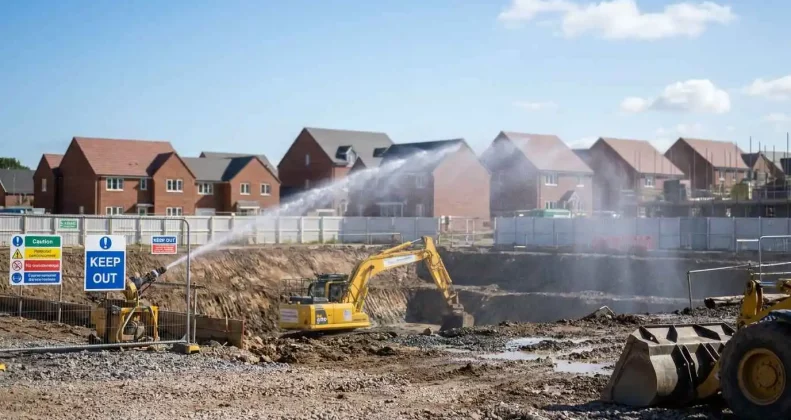
If your planning permission came with a condition about construction dust, you’ll need a Dust Management Plan before work can start. Get it right and it’s a routine step. Get it wrong and you’re looking at delays, refused condition discharge, and in the worst cases a stop notice from the council. This guide explains what a Dust Management Plan is, what UK planners expect to see in one, how the IAQM method works, what it costs, and the mistakes that catch developers out. What is a Dust Management Plan for construction? A Dust Management Plan (DMP) is a document setting out how dust from your construction site will be controlled, monitored and managed throughout the works. It identifies where dust will come from, who might be affected, what you’ll do to stop it leaving the site, and how you’ll respond if there’s a problem. Most DMPs are written because a local planning authority has attached a pre commencement condition to your permission. Until the council approves the plan, you legally can’t start the work covered by that condition. When do you need a Dust Management Plan? You’ll usually need one if any of these apply: Smaller sites away from sensitive neighbours may only need a short dust section within a wider environmental plan rather than a standalone document. How the IAQM method works: the four phases This is the part most online guides skip, and it’s the part your planning officer will be looking for. The Institute of Air Quality Management (IAQM) guidance splits construction dust into four separate activities, each assessed on its own. Phase What it covers Typical dust sources Demolition Taking down existing structures Breaking concrete, crushing, material drops Earthworks Excavating, levelling and moving soil Stripping topsoil, stockpiles, dry ground Construction Building the development itself Cutting, grinding, sanding, cement mixing Trackout Mud and dust carried onto public roads HGV wheels, unsurfaced haul routes Each phase gets its own risk rating high, medium or low based on the scale of the activity and how sensitive the surrounding area is. A site can easily be high risk for demolition but low risk for construction. The control measures you commit to should match the rating for each phase, not one blanket set of measures for the whole job. DMP, CEMP or CMP: which one do you actually need? Developers mix these up constantly. Here’s the plain difference. Document What it covers When it’s asked for Dust Management Plan (DMP) Dust and air quality only Condition specifically about dust or air quality CEMP All environmental issues — dust, noise, water, waste, ecology Larger or more sensitive schemes; dust sits inside it as a chapter CMP / CTMP Site logistics — deliveries, traffic routes, working hours Where construction traffic is the main concern What should a Dust Management Plan for Construction include? A plan that gets approved first time usually covers: Site details — location, description of the works, programme, and who’s responsible on site for dust. Dust risk assessment — the four phases assessed separately, with sensitive receptors identified and distances measured. This is the technical heart of the document. Control measures — what you’ll actually do, matched to each risk rating. Typically damping down, wheel washing, covered stockpiles, road sweeping, screening, enclosed cutting, and switching off idling plant. Monitoring — how you’ll check the controls are working. On higher risk sites this often means real-time PM10 monitoring with agreed trigger levels; on lower risk sites, daily visual inspections and a written log. Weather procedures — what happens in high winds or a long dry spell. Councils increasingly want to see a wind speed threshold at which dusty work stops. Complaints procedure — how a complaint gets recorded, investigated, and responded to, with a named contact and a timescale. How to get your planning condition discharged Once the plan is written, you submit it to the council with a discharge of conditions application and the relevant fee. The planning officer, usually with input from environmental health, reviews it and either approves it, asks for changes, or refuses it. Allow around eight weeks for determination. That’s the statutory period, and it’s the single biggest reason developers lose time the plan itself might take two or three weeks to write, but the council’s clock runs separately. Start early. What does a Dust Management Plan cost? For a straightforward site, a standalone DMP typically costs in the region of £800 to £2,000. Larger or more sensitive schemes, or a full CEMP with a dust chapter, generally run higher. Where real-time dust monitoring is required as part of the plan, equipment hire and reporting are usually costed separately. Preparation normally takes two to three weeks once we have your site details, programme and layout drawings. A real project example We recently prepared a Dust Management Plan for a construction development in the West Midlands where the council had attached a pre commencement dust condition. The site backed onto a primary school, which pushed the demolition and earthworks phases into the high risk category. Rather than applying generic measures across the board, we set phase-specific controls enclosed demolition with continuous damping, a wheel wash on the single site exit, and real time PM10 monitoring with an agreed trigger level and a stop work threshold during school drop off and pick up times. The council approved the plan without requesting amendments, and the developer discharged the condition on programme. The lesson: councils approve plans that show the site has genuinely been thought about, not plans that could apply to any site anywhere. Common mistakes to avoid How FreshBreeze can help We prepare Dust Management Plans and CEMP dust chapters for developments across London, Birmingham and Manchester, written to IAQM methodology and to the standard local authorities expect. If you’re not sure whether you need a DMP or a full CEMP, send us your condition wording and we’ll tell you before you commit to anything. Find out more about our dust management plan services, or read about
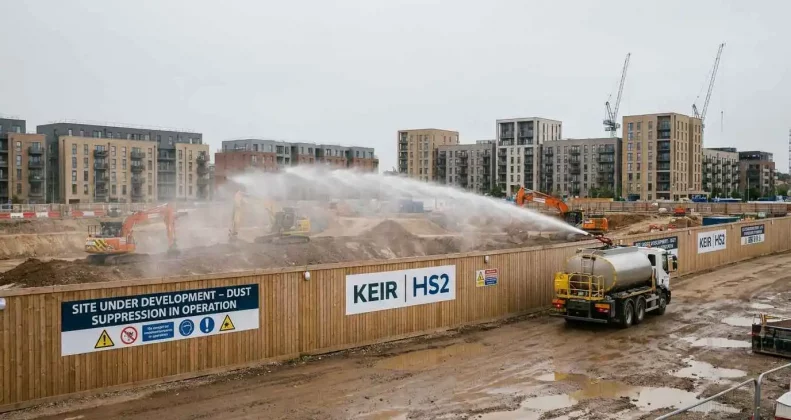
If you’re planning construction work anywhere in the UK, the way your dust risk is assessed has changed. The Institute of Air Quality Management (IAQM) updated its construction dust guidance to Version 2.2, and the changes are significant enough that the same site can now land in a completely different risk band than it would have a few years ago. For some developers that means less mitigation and lower costs. For others it means an unexpected requirement for months of baseline monitoring before a single machine turns up on site. This guide explains what actually changed, what it means in practice, and what you should do about it. What is the IAQM 2024 dust guidance? The IAQM 2024 dust guidance (Version 2.2) is the updated UK framework for assessing dust from demolition and construction. It replaces the 2014 version and sets out how consultants judge dust risk, what mitigation is expected, and when monitoring is required. It’s the document local planning authorities across the UK reference when they review a construction dust assessment, so it directly shapes what your planning conditions will say. What changed in the IAQM 2024 dust guidance? The headline change is to the dust emission magnitude thresholds the site sizes and building volumes that determine whether your project is rated Large, Medium, or Small for each phase of work. Here’s the comparison. Phase 2014 Guidance 2024 Guidance (V2.2) Demolition Large: >50,000 m³Medium: 20,000–50,000 m³Small: <20,000 m³ Large: >75,000 m³Medium: 12,000–75,000 m³Small: <12,000 m³ Earthworks Large: >10,000 m²Medium: 2,500–10,000 m²Small: <2,500 m² Large: >110,000 m²Medium: 18,000–110,000 m²Small: <18,000 m² Construction Large: >100,000 m³Medium: 25,000–100,000 m³Small: <25,000 m³ Large: >75,000 m³Medium: 12,000–75,000 m³Small: <12,000 m³ Trackout Large: >50 HDV movements/dayMedium: 10–50 HDV/daySmall: <10 HDV/day Large: >50 HDV movements/dayMedium: 20–50 HDV/daySmall: <20 HDV/day The earthworks change is the one everyone talks about, and rightly so. The Large threshold moved from 10,000 m² to 110,000 m² eleven times higher. Under the old guidance, almost any ordinary urban site was classed as Large simply because of its area. That was never the intention. The new figure reserves “Large” for genuinely major operations like infrastructure projects and strategic masterplans. But look carefully at the other rows, because two of them go the other way. Demolition and construction thresholds have come down, meaning smaller buildings now fall into higher risk bands than before. A demolition job that was Small under the old rules could now be Medium. How the changes work in practice Take a real-world example: demolishing a 15,000 m³ building on a one hectare (10,000 m²) site. Under the 2014 guidance, that demolition would have been Small (under 20,000 m³), while the earthworks would have been Large (10,000 m² hits the threshold). Under the 2024 guidance, it flips completely. The demolition becomes Medium (15,000 m³ sits in the 12,000–75,000 band), and the earthworks drop to Small (10,000 m² is well under 18,000 m²). Same site, same job, completely different risk profile and a different set of planning conditions as a result. Why the PM2.5 focus matters The 2024 guidance puts much more emphasis on PM2.5 the fine particles small enough to pass deep into the lungs and enter the bloodstream. The older framework leaned heavily on PM10 and dust soiling, essentially treating dust as a nuisance issue. In practice this doesn’t usually mean extra fieldwork. What it changes is how the assessment is written and how mitigation gets justified. If your site sits near a school, hospital, care home, or anywhere with vulnerable people, the health angle now tends to push you towards a higher tier of mitigation than site size alone would suggest. Receptor sensitivity carries more weight than it used to. Screening at outline planning stage One genuinely useful addition is the recommendation to screen dust risk at outline planning application stage, with the detailed work following at reserved matters or full application. The old guidance said little about outline stage, so dust was often ignored until reserved matters by which point the site layout was fixed and any design fix was expensive or impossible. A screening note at outline is short, usually four to six pages, and answers three questions: will a detailed assessment be triggered later, roughly what magnitude band are we looking at, and what should the design team factor in now? It isn’t mandatory, but many councils now expect it, particularly on dust-sensitive sites. The baseline monitoring trap most developers miss This is the point that catches people out, and it’s barely mentioned anywhere else. Medium risk projects are normally expected to carry out continuous particulate monitoring. And some councils will ask for up to three months of baseline monitoring before construction even begins, so there’s data showing what the pollution levels were beforehand. That’s a three month hole in your programme if nobody spotted it. Because the demolition and construction thresholds dropped, more schemes are now landing in Medium than before, which means more schemes are hitting this requirement unexpectedly. If you’re planning a project in a city where councils take this seriously, factor it in early not when you’re trying to discharge a pre commencement condition. Our air quality monitoring team can advise on what baseline data your local authority is likely to want. Changes to mitigation expectations The mitigation measures in the 2024 guidance will look familiar, but several have been tightened: All of this normally sits within your dust management plan or the air quality section of a CEMP. What this means for your project — a real example We recently reviewed a mixed-use scheme in the West Midlands where the developer was working from a dust assessment prepared under the old 2014 framework. The site had been classed as high risk largely because of its area, and the resulting conditions required an extensive mitigation package. Re-running the assessment under the 2024 thresholds dropped the earthworks magnitude by two bands. The demolition element moved up slightly, but the overall risk rating fell. We revised the dust management plan to match
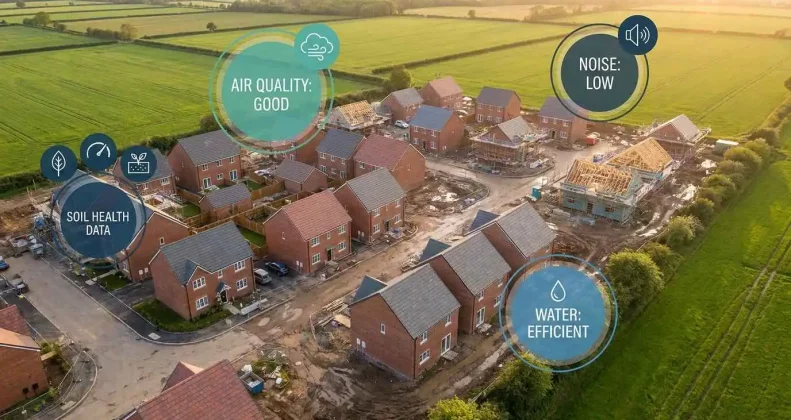
You’ve found a site. You’ve drawn up plans. And now your local planning authority has asked for an air quality assessment and you’re not entirely sure what that means, how much it costs, or how long it takes. You are not alone. Air quality is one of the most misunderstood requirements in the UK planning system yet it’s also one of the most important. Get it wrong and your planning application stalls. Get it right, and your development moves forward with confidence. In this guide, our chartered environmental consultants explain everything residential developers need to know about air quality assessments in plain, jargon-free language. Whether you’re building 5 homes or 500, this guide will help you understand exactly what’s required and why. What Is an Air Quality Assessment? An air quality assessment (AQA) is a technical report that evaluates two things: How your proposed development will affect local air quality — for example, will it generate traffic that adds NO2 to an area already struggling with pollution? How existing air quality will affect future residents — for example, are people going to be living next to a busy A-road where NO2 levels already exceed the legal limit? Both directions matter. A development might have a perfectly clean design but still be an inappropriate location for residential use if the surrounding air quality poses a risk to health. Equally, a large development may itself become a significant source of pollution that worsens conditions for existing residents nearby. The assessment is prepared by a qualified air quality consultant using technical guidance from the Institute of Air Quality Management (IAQM), Environmental Protection UK (EPUK), and Defra’s Local Air Quality Management (LAQM) Technical Guidance TG22. The resulting report is submitted as part of your planning application for the local planning authority (LPA) to review. When Does a Residential Development Require an Air Quality Assessment? Not every planning application triggers the need for a full air quality assessment. Whether one is required depends on several factors, including site location, development scale, and the likely sources of pollution nearby. Here are the most common triggers: 1. Your Site Is Within or Near an Air Quality Management Area (AQMA) An Air Quality Management Area is a zone declared by a local authority where national air quality objectives are being or are likely to be exceeded. If your residential development sits within or adjacent to an AQMA, the LPA will almost certainly require an air quality assessment for planning before they can determine your application. AQMAs are most commonly declared for nitrogen dioxide (NO2) from road traffic. In cities like Birmingham, London, and Manchester, many residential planning sites fall within AQMA boundaries which is why developers working in these areas frequently need to commission assessments. 2. Your Development Will Generate Significant Traffic Even if your site isn’t inside an AQMA, a residential development that generates substantial additional vehicle movements can increase pollutant concentrations on nearby roads. Local planning authorities in England use the EPUK/IAQM significance criteria to decide whether the additional traffic warrants a full assessment. Typically, if a development generates more than 500 additional vehicle movements per day (AADT) near a road that is already close to or exceeding air quality limits, an assessment will be required. 3. Large-Scale Residential Schemes For major developments generally 10 or more dwellings in England, or those with a site area greater than 0.5 hectares local planning authorities are likely to require an air quality assessment as standard, regardless of AQMA location. This is in line with national planning policy and local validation checklists. Some local authorities set their own thresholds, so always check with the LPA’s Environmental Health Officer (EHO) at pre application stage. 4. Developments Introducing New Sensitive Receptors Residential properties, care homes, schools, and nurseries are all classed as “sensitive receptors” because the people within them are particularly vulnerable to air pollution. If your development proposes to introduce sensitive receptors into an area where air quality is already poor for example, next to a motorway junction or an industrial estate the LPA must satisfy itself that future occupants will not be exposed to harmful levels of pollution. 5. Combustion Plant or Energy Systems If your development includes biomass boilers, combined heat and power (CHP) systems, gas boilers above a certain size, or backup generators, these combustion sources will themselves require an air quality assessment. This is relevant to residential developments with district heating systems or large energy centres, which are increasingly common in urban regeneration schemes. What Pollutants Are Assessed in a Residential Air Quality Assessment? Most residential development assessments focus on a core set of pollutants. The exact list depends on what’s near your site a development next to a busy A-road will be dominated by traffic related pollutants, while a site adjacent to an industrial facility may also need to consider sulphur dioxide (SO2) or volatile organic compounds (VOCs). The table below summarises the main pollutants you are likely to encounter in a UK residential air quality assessment, along with the relevant air quality objectives (AQOs) and health significance: The Air Quality Assessment Process — Step by Step Understanding what actually happens during an air quality assessment helps you plan your project timeline and brief your team effectively. Here is how a typical residential assessment unfolds: Scoping and Screening Your consultant reviews the development proposals, checks whether the site is within an AQMA, assesses nearby pollution sources, and applies the EPUK/IAQM screening criteria to determine whether a full assessment is needed and what it should cover. This is the most important step it defines the scope of work and the likely cost. A well scoped assessment avoids both under reporting (which risks refusal) and over engineering (which wastes your budget). Baseline Data Collection and Monitoring The consultant collects existing air quality data for the area. This may come from the local authority’s own monitoring network, Defra’s UK Air database, or bespoke monitoring equipment installed at the site. For NO2, diffusion tubes are the most common approach for residential assessments they

